At the end of Part Two our Galactic explorers had produced the first true maps of our Galaxy, showing its shape and extent, by using radio telescopes to map the distribution of atomic hydrogen, so revealing the spiral arm structure. In the concluding portion of this article we turn to millimetre-wave radio telescopes and the mapping of the Galaxy in molecules closely hugging the spiral arms. They reveal the giant molecular clouds where stars are born.

The author, Michael Burton, on top of Mopra Rock in the Warrumbungles National Park of New South Wales. The 22m diameter Mopra radio telescope, star of the tale told here, lies below and behind him. (Image credit: Michael Burton)
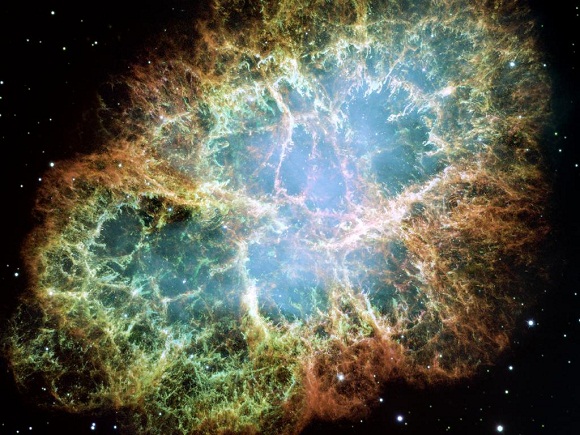
Molecular gas is evident in the dark bands that obscure the visible maps of the sky. These are the clouds which confounded Herschel in his first attempt to map the Galaxy. They are also the sites where stars are born. Molecular clouds are the most massive objects in our Galaxy, and are tightly confined to its spiral arms.
Molecular clouds are dominated by hydrogen molecules (H2). However, at their extremely cold temperatures – typically just 10 to 20 degrees above absolute zero – these molecules remain in their ground energy state. They do not produce spectral lines that can be measured. Our knowledge of the distribution of molecular clouds in space is provided by a tracer – the carbon monoxide molecule (CO). It is the second most abundant molecule in space, though only about one ten thousandth as common as H2.
Carbon monoxide can also be measured by radio telescopes, but its principal emission line comes out at a wavelength 100 times shorter than that for the hydrogen atom. This is at 2.6mm in what is known of the millimetre portion of the spectrum. The technology for mm-wave detection is more challenging than for cm-wave detection, and the Earth’s atmosphere is also less receptive to its passage. Moreover, the much shorter wavelength means that the size of the telescope beam on the sky is correspondingly far smaller. It thus takes much, much longer to map the sky at millimetre wavelengths than at centimetre wavelengths. On the other hand, the resulting images are sharper and the velocity resolution much finer. Motions in the gas of less than a kilometre a second can readily be recorded.

Left: The northern Mini of the two 1.2m diameter radio telescopes used for the Colombia survey. The New York city skyline lies behind. The name is not an acronym, but was chosen because of the small size of the telescope! (Image Credit: Thomas Dame, Harvard-Smithsonian Center for Astrophysics, USA) Right: The southern Mini telescope, at the Cerro Tololo Interamerican Observatory (CTIO) in Chile, with the Atacama desert to rear
The first comprehensive map of the Galaxy’s molecular clouds was not made until 1987. Known as the Colombia survey, it was led by Thomas Dame, and used two 1m-sized radio dishes, one in each hemisphere. The northern dish was actually on top of Colombia University (hence the name) in the middle of New York City! This was in contrast to the trend back then in optical astronomy to move away from the city lights. At the time, however, there was no need to move to a better (and more challenging) site, so new was the field of millimetre astronomy. The southern telescope was later placed in the Atacama desert of Chile, a far superior site, the forerunner for future millimetre telescopes to also be placed in the driest locations on our planet.
The images below show the distribution of the molecular gas across the Galactic plane measured in the Colombia survey. Roughly one billion solar masses of molecules are evident in this map! The data sets are actually cubes, not images, with the third dimension being velocity. This provides a proxy for distance, given the Galactic rotation curve. But it is a challenge to succinctly summarise such a vast data set on a 2D page. The lower image displays a technique radio astronomers frequently adopt in an attempt to do so – a position-velocity diagram. Here one axis shows the distribution along the Galactic plane, but the second axis now displays velocity, not galactic latitude[1]. The intent is to show the kinematic structure – the result of orbital motions of the gas. The largest structures we see in it arise from the spiral arms, and their differing radial velocities with position in the Galaxy. No simple pattern can describe the structure, indeed a completely different structure is evident within the very inner portion of the Galaxy, where the gas motions extend to more 250 km/s (positive and negative) from us. This is a region we call the Central Molecular Zone. It is an environment very different to that of the spiral arms.

The map of the carbon monoxide (CO) emission across the Galaxy from the Colombia survey made using the two Mini telescopes (click on image to enlarge). The top image shows the total flux measured in the CO line, and the bright band running through the centre of the image is the plane of Galaxy. The coordinates are galactic longitude and galactic latitude, with the galactic centre being at (0°, 0°).
The bottom image shows a position – velocity diagram, allowing the kinematic structure (i.e. the motions of the gas) to be represented on the 2D page. The horizontal axis is again the galactic longitude, but the vertical axis represents the velocity of the gas (i.e. towards or away from us). The various arcs and filamentary structures represent the spiral arms, each of which has a unique kinematic structure reflecting it distance and motion with respect to the Sun. These are typically at speeds up to 100 km/s (positive and negative). The map shows where the giant molecular clouds are found, each weighing up to one million times the mass of the Sun. However, in the very central region of the Galaxy the gas motions extend up to ±250 km/s – the Central Molecular Zone. Here are found about 100 million solar masses of molecules, encompassing the central few hundred light years of the Galaxy.
(Image Credit: Thomas Dame. From Dame, T, Hartmann, D and Thaddeus, P, The Milky Way in Molecular Clouds: a new complete CO survey, 2001, Astrophysical Journal, 547, 792.)

The 22m diameter Mopra radio telescope, sited at the foot of Siding Spring Observatory in New South Wales, Australia. The author is pointing to the telescope, and provides a sense of scale for the size of the dish. (Image credit: Michael Burton)
The latest chapter in the exploration of the Galaxy comes from Australia and is led by the author of this article. It uses the Mopra millimetre-wave telescope in the state of New South Wales, a 22m radio dish. Mopra is sited at the foot of the mountain housing Siding Spring Observatory, where the famous 4m diameter optical Anglo Australian Telescope lies. Being 20 times larger than the Colombia survey dishes, Mopra is able to produce an image that is 20 times sharper in resolution – just 30 seconds of arc, about one sixtieth the size of the Moon on the sky. This is sufficient to resolve many internal structures within the giant molecular cloud complexes first mapped by the Colombia survey.

The position-velocity map of the molecular gas across half of the Fourth (Delta) Quadrant of the Galaxy, as so far mapped using the Mopra telescope. As with the corresponding image shown earlier for the Colombia survey, Galactic latitude is along the x-axis, and velocity with respect to the Sun is along the y-axis. The arcs that are overlaid are the best estimates for positions of the four spiral arms, as has been determined by Jacque Vallée (not the UFOlogist), though as is apparent the comparison between model and data clearly remains imperfect. (Image Credit: Michael Burton)
With modern spectrometers the velocity resolution is also an order of magnitude better, able to resolve gas motions as small as one tenth of a kilometre per second. The spectrometer also allows several different lines of the CO molecule to be measured simultaneously. These arise from isotopes of the carbon and oxygen atoms. The multiple lines allow us to make corrections for the extinction that still occurs, needed to accurately calculate the amount of gas that is present. We show some sample data from the survey in the images below, a position-velocity plot that covers 50° along the Galactic plane, as well as movies showing the data set in comparison with both the atomic hydrogen and the Colombia CO surveys. The effect of an order of magnitude improvement in resolution is dramatic in the sharpness of the image!
The survey started with fire, literally, when a vast bushfire through the Warrumbungles National Park in January 2013, almost destroying the telescope. But we survived, just, even though the observatory lodge and out buildings were destroyed.
The high fidelity of the map also means that the survey is taking a long time to complete. We are now entering the 5th season with Mopra, observing through the winter months when the conditions are best for millimetre-wave observing. The first pass along the 4th Quadrant of the Galaxy is about to be completed, along the Galaxy’s least-explored Delta quadrant (which turns out to not be quite as seen by Captain Janeway during her tour of this quadrant in Star Trek: Voyager!). It has covered most of the inner 1° in latitude of the Galaxy, where much of the molecular gas lies. We are hoping to extend the survey to cover the inner 2°, and so include the vast majority of the Galaxy’s molecular gas. But it is a race against time to do so, as the funding to keep Mopra operational has nearly run out. A crowd funding campaign by Team Mopra at the end of 2015 kept the telescope running into this year. Now, as the Austral winter of 2016 begins, we are at the start of what may be the last season for Mopra, unless further resources can be found to keep the telescope running and make it possible to complete the charting of the molecular gas in our exploration of Galaxy’s Delta Quadrant….

The Milky Way in visible light, as seen above the Mopra Telescope. The wonderfully dark skies of Australia provide for exceptional viewing of the spectacular southern skies. (image credit Balthasar Indermuehle)
[1] The emission is averaged over the latitude direction in this figure.
(Part One of this series can be found at this link and Part Two is at this link)
Article by Michael G. Burton, Director of Teaching in the School of Physics at the University of New South Wales. Director and CEO of Armagh Observatory and Planetarium (Commencing 1 August 2016)


0 Comments